
Technology is moving faster than ever – we’re seeing more sophisticated ATMS, connected infrastructure, more flexible interfaces, more powerful functionality.
But the way we implement it is stuck in the past.
Beacon has a new approach to delivering technology that moves as quickly as we think, takes work off of our plates, and pulls our most important tasks into focus. A foundation for how we know we need to operate in the future.
We start with the (heavyweight) systems engineering process. It’s the right idea! It helps people understand and solve complex problems by taking something very complex, breaking it into smaller parts, and putting it back together again.
At the core of systems engineering is traceability – the idea that you can take any element, and look both upstream and downstream. It’s appalling that to track traceability we use…spreadsheets! Consider a real-life example of a spreadsheet with a staggering 3,000 rows, 200 columns, and 65 versions. Imagine navigating such a massive dataset and trying to extract coherent insights. Daunting to say the least, and leaves stakeholders overwhelmed and under-informed. These spreadsheets and other disparate tools become the central repository for crucial information.
Flexibility is critical. The sheer volume of hours dedicated to manual entry and regular updates of information becomes a daunting task – and it’s hard to stay agile. You can keep up in theory but not in practice.
We believe there’s a better way.
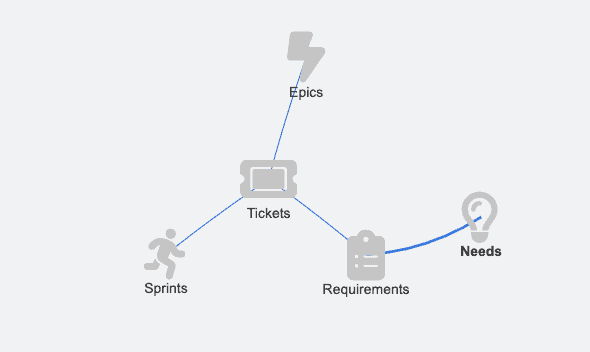
Don’t underestimate how many different types of information you have: user needs, requirements, tickets, pull requests (code), meeting notes, lists of action items, reports, standards documents…to name just a few.
The Knowledge Graph is the new way. It focuses on the connection between things. At its core, that’s traceability: how does this requirement relate to this need…to this task…to this test.
It’s quicker and better than a spreadsheet. This is a simple but transformative shift from static data to inherently agile data management. Such agility ensures that data systems can pivot and adapt with minimal friction, aligning closely with the dynamic needs of modern software-based projects.
What if a knowledge graph could help us make sense of it all? Could a graph keep us focused, organized, and in control?
We’d be more efficient: tasks that once took a week can be accomplished in mere minutes.
We’d have more visibility into project progress: it distills the often convoluted landscape of project data into a format that’s more digestible for stakeholders. Stakeholders aren’t left navigating a labyrinth of data; instead, they receive a clear, cohesive overview, ensuring they remain informed and aligned with the project’s trajectory.
We could easily do impact analysis: when there’s a modification in requirements or an unforeseen delay in the project, a knowledge graph lets you highlight the resulting effects across all related pieces and parts.
As the technological landscape continually evolves – and we’re increasingly reliant on and desire to take advantage of new technology – it’s worth revisiting the how.